Stages of an Observability Maturity Model for Software Teams
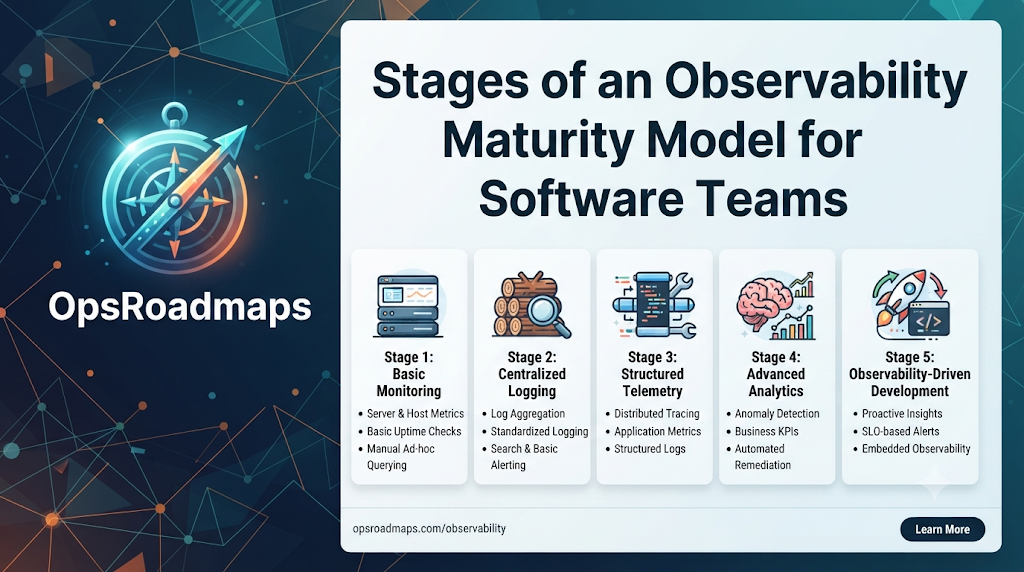
An observability maturity model describes how well a team can understand what is happening inside its software by looking at the data the software produces. It helps you see where you are today and what to improve next.
The simplest way to judge your level is to ask what questions your team can answer when something goes wrong. A team at an early stage can say whether a service is up. A team at a later stage can say why one group of users sees slow pages and what to fix first. This article walks through four stages using that idea.
Monitoring and Observability Are Not the Same
The two words are often mixed up, so it helps to separate them.
- Monitoring watches for problems you already know about. You decide in advance what to check, such as server load or error counts, and you get an alert when a value crosses a line.
- Observability lets you investigate problems you did not expect. If your systems produce rich, connected data, you can ask new questions without changing the software.
Monitoring is part of observability, not a replacement for it. Most teams need both.
The Data Behind Observability
Observability depends on signals that your software sends out. The three most common are:
- Metrics: numbers measured over time, such as requests per minute or the share of failed requests.
- Logs: written records of events, such as an error message with details.
- Traces: a record of the path one request takes through many services, showing how long each step took.
Some teams also use events, such as a new release, and profiles, which show where code spends its time. The strength of the model comes less from collecting more data and more from making the signals work together.
The Four Stages
There is no single official model. The stages below are a general way to explain the idea. They are not the scoring rules of any specific platform, and your own team may draw the lines a little differently.
Stage 1: Basic Monitoring
The question you can answer: “Is it up?”
At this stage, you have a few health checks and some dashboards for servers or containers. Alerts are mostly based on resource use, such as high CPU. Logs live on individual machines, and finding a problem often means logging in and searching by hand.
Typical signs: Customers report problems before alerts do. Different people check different places. Fixes depend on a few experienced engineers.
Stage 2: Organized Signals
The question you can answer: “Which service is failing?”
Now the data is gathered in one place. Logs follow a shared format, metrics use consistent names, and every service has a standard set of dashboards. Alerts cover the basics for each service, such as error rates and response times.
Typical signs: The team can find the failing service quickly, but may still struggle to explain why. Alerts can be noisy, and some are ignored.
Stage 3: Connected Signals
The question you can answer: “Why is this request slow, and where is the delay?”
The signals are linked. A shared request identifier appears in logs, metrics, and traces, so you can follow one user’s request across many services. Alerts focus on what users feel, such as failed checkouts, rather than on server details alone.
Typical signs: Investigations take less time. Engineers can move from a dashboard to a trace to a log line without guessing. The team can answer new questions without new code.
Stage 4: Signal-Driven Decisions
The question you can answer: “What should we fix next, and did the fix work?”
Observability data now guides decisions, not only emergencies. The team sets service level objectives, checks health during releases, reviews trends, and uses data to rank improvement work. It also keeps an eye on the cost of the data itself.
Typical signs: Reviews after incidents lead to better signals. Releases are checked against clear measures. Spending on tools is reviewed, and unused data is removed.
A Quick Look at the Questions
| Question | Stage where it becomes answerable | Evidence to look for |
|---|---|---|
| Is the service up? | 1 | Health checks, uptime reports |
| Which service is failing? | 2 | Central dashboards, shared log format |
| Why is this request slow? | 3 | Traces linked to logs and metrics |
| Which users are affected? | 3 | Data grouped by region, version, or customer type |
| Did the last release make things worse? | 4 | Release markers on dashboards, before and after comparisons |
| What should we fix first? | 4 | Reliability targets, trend reviews |
A Simple Self-Check
Rate each area honestly, and write down the proof. A DevOps maturity assessment can add context about your wider delivery process, but any self-assessment reflects what your team reports and the evidence it has. It is not an independent audit or a certification.
| Area | What to ask | Proof |
|---|---|---|
| Coverage | Does every important service send metrics, logs, and traces? | Service list with signal status |
| Quality | Are names and formats consistent across teams? | Written standards, sample data |
| Connection | Can you follow one request across services? | A traced example from a real request |
| Alerts | Do alerts point to user impact and lead to action? | Alert history with outcomes |
| Use | Do you use the data to guide priorities? | Review notes, backlog items linked to data |
| Cost | Do you know what you pay for data, and why? | Cost report by team or signal |
| Ownership | Does each service have an owner for its signals? | Named owners in a service list |
Your overall stage is often held back by your weakest area. Strong dashboards cannot make up for alerts that nobody trusts.
How to Move to the Next Stage
From Stage 1 to Stage 2
- Collect logs and metrics in one central place.
- Agree on a log format and naming rules.
- Build a standard dashboard template for every service.
From Stage 2 to Stage 3
- Add tracing to the most important user journeys first.
- Attach a shared request identifier to logs, metrics, and traces.
- Move alerts toward user-facing symptoms and remove those that nobody acts on.
- Consider an open, vendor-neutral standard such as OpenTelemetry for collecting data, which can reduce lock-in.
From Stage 3 to Stage 4
- Set reliability targets for key services.
- Mark releases on dashboards and compare behavior before and after.
- Use incident reviews to find missing signals, and add them.
- Review the cost and value of your data regularly.
Keep the Cost Under Control
More data is not always better. Large volumes of logs and highly detailed metrics can grow the bill quickly.
- Keep what you use. Remove signals nobody looks at.
- Set sensible retention periods, with detailed data kept for a short time and summaries kept longer.
- Sample traces for busy services, and keep full detail for errors and slow requests.
- Watch for metrics with too many unique label values, which often drive cost up.
This connects to wider cloud spending. If your cost work follows a cloud cost optimization roadmap, include your observability tools in it.
Mistakes That Stall Progress
- Buying a tool and calling it done. A tool does not create maturity. Habits and standards do.
- Collecting everything. Data without a question to answer is only cost.
- Alerting on every change. Too many alerts lead to alert fatigue, and people stop responding.
- Ignoring consistency. If every team names things differently, combining data is painful.
- Leaving out ownership. Signals decay when nobody looks after them.
A Hypothetical Example
This example is made up to show the process. It is not a real case.
A team runs a ticket booking service made of several smaller services. Checkout sometimes feels slow, but the dashboards only show that some requests fail. The team is at Stage 2. They add tracing to the checkout journey and attach one request identifier to every log line. The next time checkout slows down, a trace shows that most of the delay is in one call to an outside payment provider, and logs show it only happens for one type of card. They add a timeout and an alert for that specific delay.
They did not buy more tools. They connected the signals they already had and added a few missing pieces.
Where OpsRoadmaps Fits
OpsRoadmaps is an engineering operations assessment and improvement platform. Observability engineering is one of the disciplines it covers, and its library includes observability improvement frameworks. It also offers a free operational health scan that needs no account. Its assessments use published, versioned scoring rules, and the results are self-reported rather than independently audited.
Frequently Asked Questions
Do we need logs, metrics, and traces all at once?
No. Many teams begin with metrics and logs, then add traces for the most important user journeys. Add each signal when you have a clear question it can answer.
Is a higher stage always better?
Not always. Choose the stage that fits your risk and your size. A small internal tool does not need the same depth as a payment system.
How long does it take to reach Stage 3?
It depends on the number of services and how consistent they are. Teams with standard templates and shared tooling often move faster than teams where each service is different.
What is alert fatigue?
It is what happens when people receive so many alerts that they stop paying attention. Reduce it by alerting only on issues that need action and by reviewing alerts that never lead to anything.
Does OpenTelemetry replace monitoring tools?
No. It is a standard for creating and collecting telemetry data. You still need tools to store, search, and display that data.
Who should own observability?
Each service team should own the signals for its own service, while a shared platform or reliability group often provides standards, templates, and shared tools.
How is this different from an incident management maturity model?
This model looks at how well you can see and understand your systems. An incident management maturity model looks at how you respond and learn when something fails. They support each other, because better visibility leads to faster response.
Conclusion
An observability maturity model gives your team a clear way to describe where it stands and what to improve. Move from basic monitoring to organized signals, then to connected signals, and finally to decisions driven by data. At each step, ask which new question your team will be able to answer. Keep the data useful, keep the cost in check, and give every service an owner.
Leave a Reply